Remote View
Eugene/Springfield Crime
Eugene/Springfield Crime
Numbers are derived from calls published on the EPD and SPD dispatch logs.
Note that not all calls are published (e.g. Suicidal Subject), not all calls result in dispatch of an officer, and not all calls are actionable (i.e. an officer is dispatched, but the person/problem is not found).
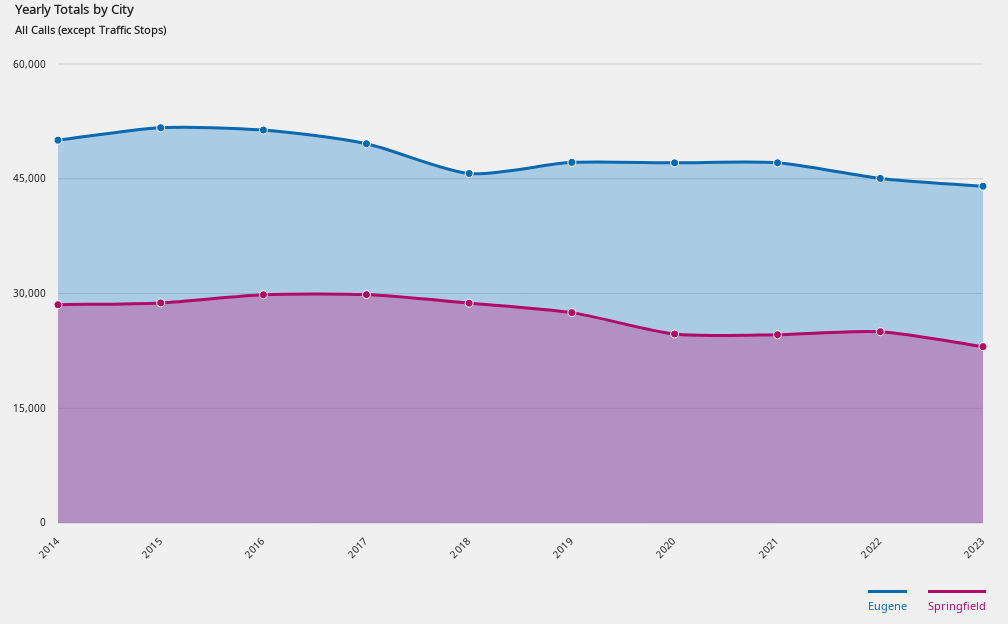
All Calls (except Traffic Stops)
         Year   Eugene   Springfield
    ------ -------- -------------
     2014   50,042   28,534
     2015   51,669   28,772
     2016   51,366   29,838
     2017   49,580   29,855
     2018   45,683   28,736
     2019   47,141   27,501
     2020   47,078   24,705
     2021   47,088   24,611
     2022   45,046   25,001
     2023   44,021   23,055
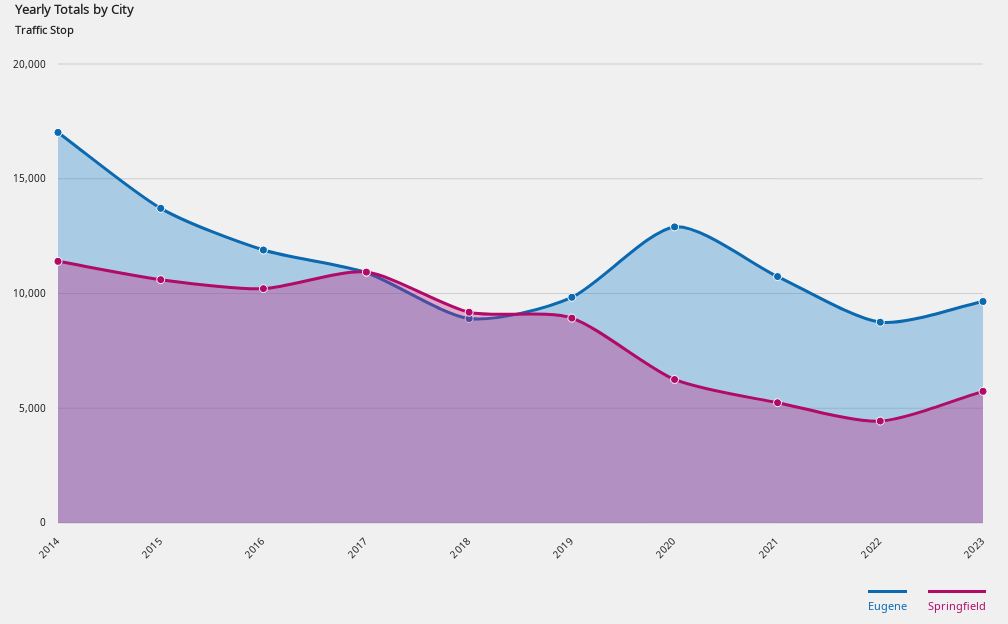
Traffic Stop
         Year   Eugene   Springfield
    ------ -------- -------------
     2014   17,018   11,401
     2015   13,710   10,603
     2016   11,894   10,212
     2017   10,905   10,932
     2018    8,908    9,184
     2019    9,834    8,928
     2020   12,901    6,253
     2021   10,738    5,241
     2022    8,748    4,440
     2023    9,651    5,737
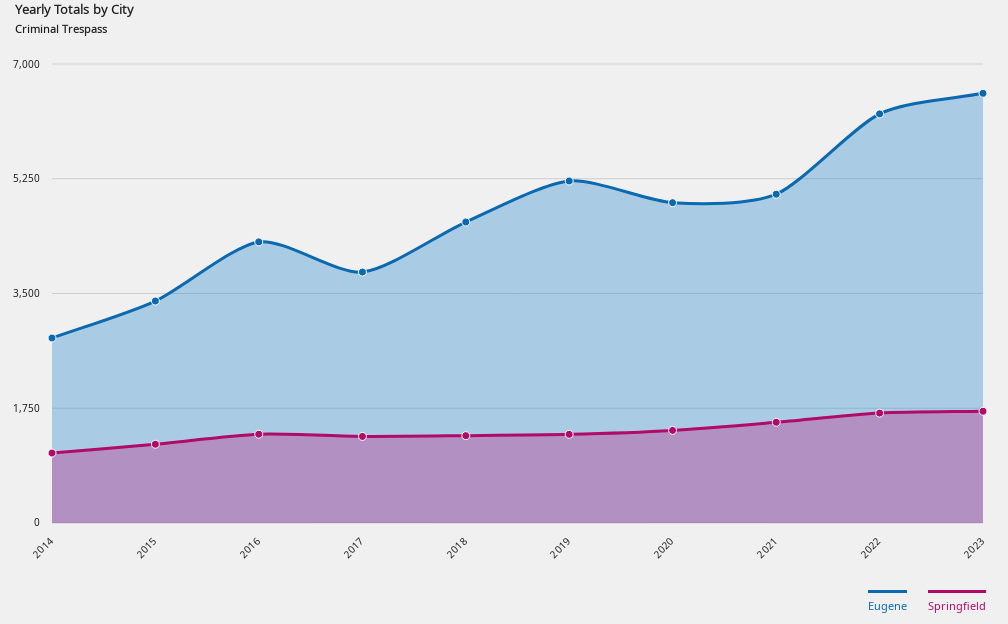
Criminal Trespass
         Year   Eugene   Springfield
    ------ -------- -------------
     2014    2,821    1,067
     2015    3,385    1,201
     2016    4,287    1,354
     2017    3,827    1,320
     2018    4,590    1,332
     2019    5,216    1,352
     2020    4,885    1,412
     2021    5,014    1,536
     2022    6,239    1,676
     2023    6,553    1,704
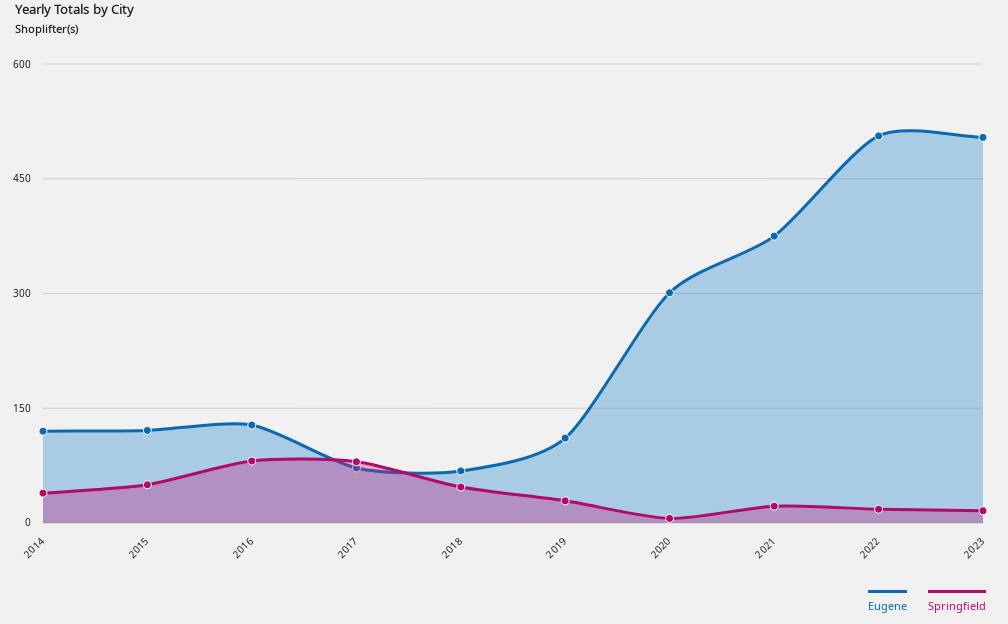
Shoplifter(s)
         Year   Eugene   Springfield
    ------ -------- -------------
     2014      120       39
     2015      121       50
     2016      128       81
     2017       72       80
     2018       68       47
     2019      111       29
     2020      301        6
     2021      375       22
     2022      506       18
     2023      504       16
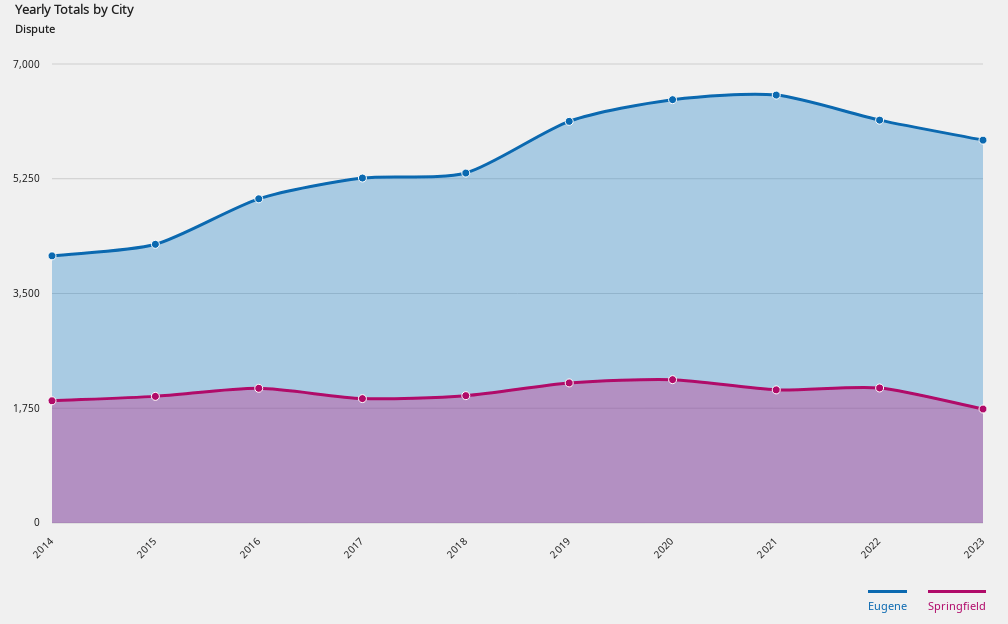
Dispute
         Year   Eugene   Springfield
    ------ -------- -------------
     2014    4,074    1,864
     2015    4,250    1,931
     2016    4,944    2,054
     2017    5,261    1,897
     2018    5,337    1,942
     2019    6,125    2,136
     2020    6,456    2,186
     2021    6,526    2,030
     2022    6,144    2,059
     2023    5,839    1,738
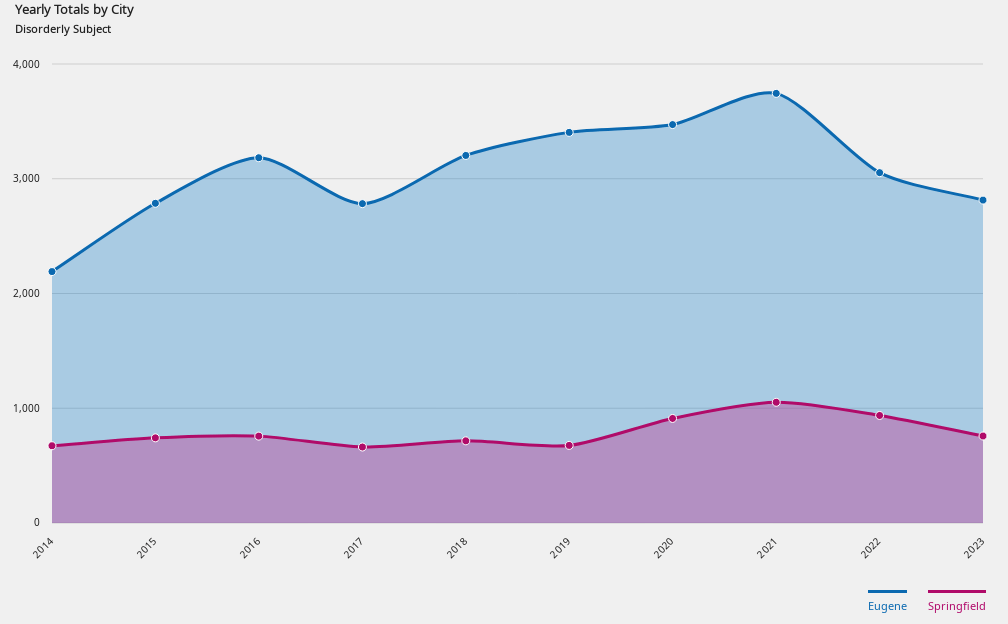
Disorderly Subject
         Year   Eugene   Springfield
    ------ -------- -------------
     2014    2,191      673
     2015    2,786      742
     2016    3,183      757
     2017    2,783      662
     2018    3,203      716
     2019    3,404      676
     2020    3,472      911
     2021    3,744    1,052
     2022    3,053      937
     2023    2,814      758
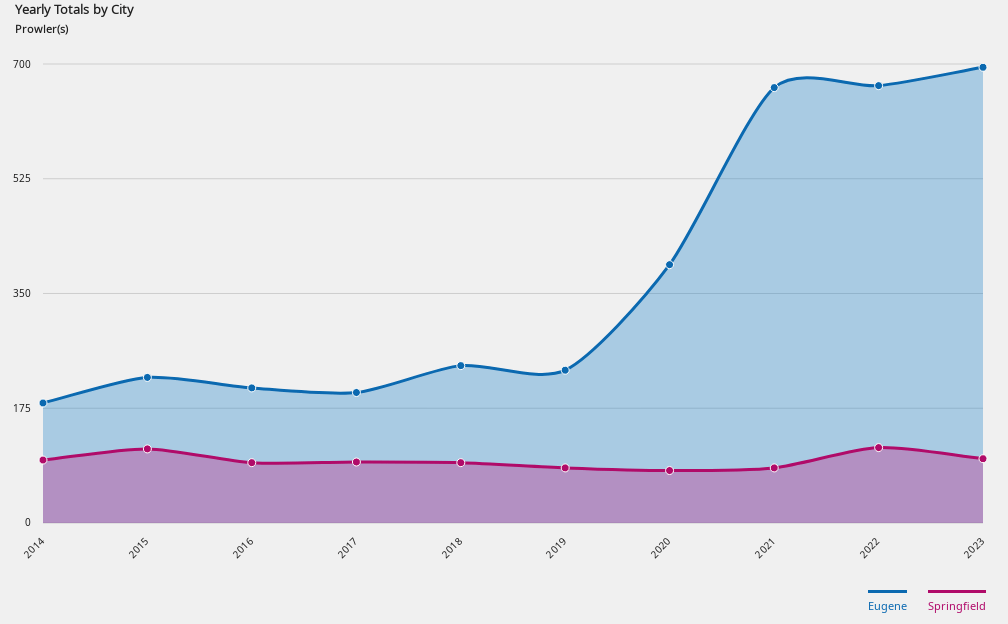
Prowler(s)
         Year   Eugene   Springfield
    ------ -------- -------------
     2014      183       96
     2015      222      113
     2016      206       92
     2017      199       93
     2018      240       92
     2019      233       84
     2020      394       80
     2021      664       84
     2022      667      115
     2023      695       98
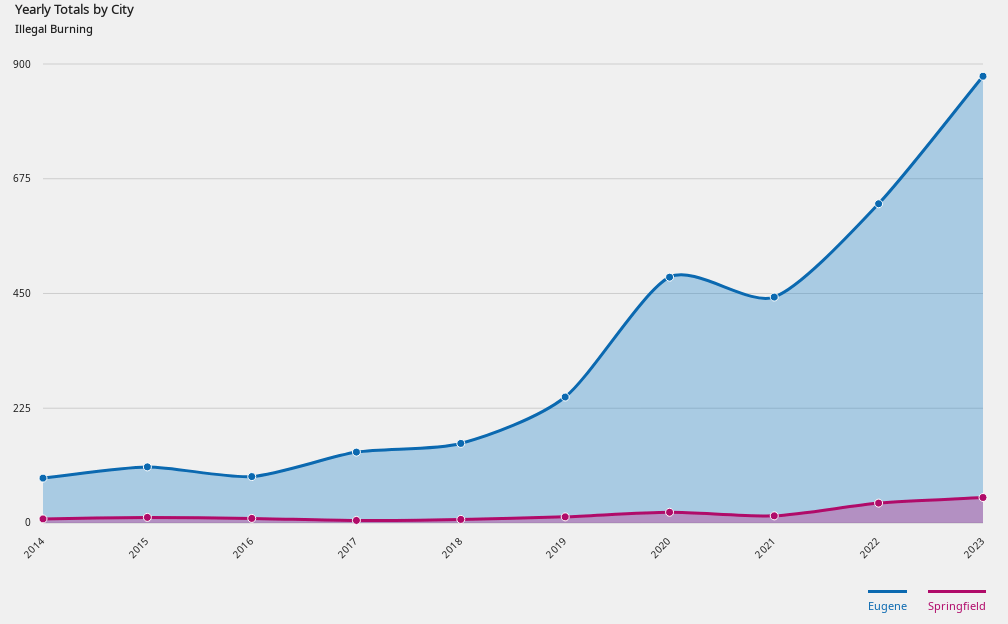
Illegal Burning
         Year   Eugene   Springfield
    ------ -------- -------------
     2014       88        8
     2015      110       11
     2016       91        9
     2017      139        5
     2018      156        7
     2019      247       12
     2020      482       21
     2021      443       14
     2022      626       39
     2023      876       50
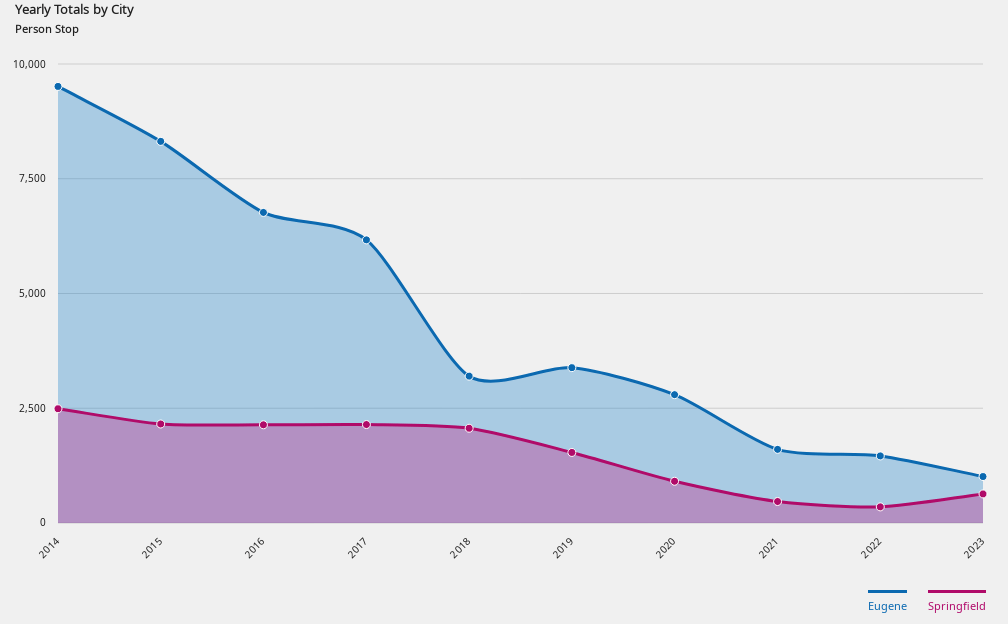
Person Stop
         Year   Eugene   Springfield
    ------ -------- -------------
     2014    9,511    2,489
     2015    8,314    2,157
     2016    6,766    2,139
     2017    6,168    2,145
     2018    3,200    2,064
     2019    3,384    1,537
     2020    2,796      909
     2021    1,604      468
     2022    1,461      351
     2023    1,012      633
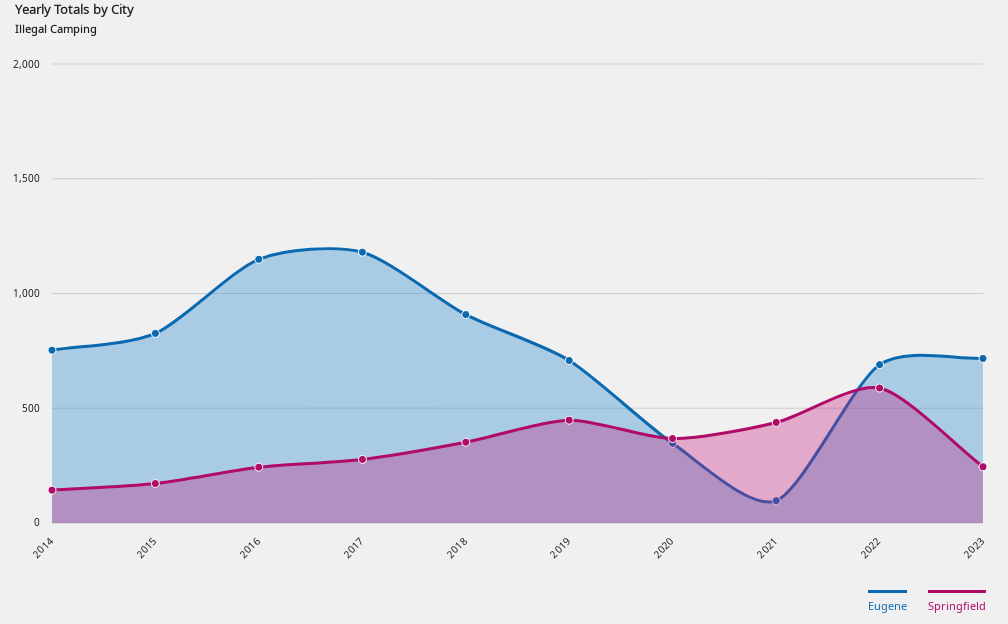
Illegal Camping
         Year   Eugene   Springfield
    ------ -------- -------------
     2014      753      143
     2015      826      172
     2016    1,149      243
     2017    1,180      277
     2018      908      352
     2019      708      448
     2020      347      368
     2021       97      438
     2022      690      588
     2023      717      245
Year 2023 Summary (top 40 incidents, Eugene & Springfield combined)
           %       Count    Incident Type
    -------  --------  ---------------
     18.66    15,388    Traffic Stop
     10.01     8,257    Criminal Trespass
      9.19     7,577    Dispute
      4.33     3,572    Disorderly Subject
      3.34     2,751    Theft
      3.31     2,729    Suspicious Condition(s)
      2.41     1,985    Traffic Hazard
      1.99     1,645    Person Stop
      1.88     1,547    Burglary
      1.64     1,353    Alarm
      1.62     1,338    Warrant Service
      1.60     1,319    Criminal Mischief
      1.59     1,311    Suspicious Subject(s)
      1.47     1,214    Driving While Suspended
      1.35     1,114    Unauthorized Use of Vehicle
      1.31     1,078    Motor Vehicle Unknown
      1.27     1,045    Theft from Vehicle
      1.25     1,032    Abandoned Vehicle
      1.17       966    Loud Noise
      1.17       965    Hit and Run
      1.17       962    Illegal Camping
      1.12       926    Illegal Burning
      1.11       915    ATL Drunk Driver
      1.11       913    Disabled Vehicle(s)
      1.10       908    Assist Outside Agency
      1.06       877    Assault
      0.96       793    Prowler(s)
      0.93       770    Found Property
      0.85       704    Reckless Driving
      0.81       665    Unknown Problem
      0.77       635    Suspicious Vehicle(s)
      0.75       616    Dog(s) at Large
      0.68       563    Motor Vehicle No Injury
      0.68       558    Missing Person(s)
      0.63       520    Shoplifter(s)
      0.60       494    Shot(s) Fired
      0.56       459    Animal Complaint
      0.53       440    Disorderly Juvenile(s)
      0.50       416    Animal Cruelty
      0.44       362    Theft ID